Methods
PM2.5 10-km prediction model >
TAP developed a two-stage machine learning model to predict daily PM2.5 concentrations with complete spatial coverage. The structure of our model is shown below. The data sources include PM2.5 measurements, satellite AOD (aerosol optical depth) retrievals, online CMAQ simulations, meteorological reanalysis data, land use information, and population distribution. The first-stage model predicts the high pollution events and employed the SMOTE algorithm to resample the model training data, thus balanced the proportion of high pollution events and normal events in the model training dataset. The first-stage random forest model trained with the resampled data predicts high pollution events. The second-stage model predicts the residual between CMAQ PM2.5 simulations and PM2.5 measurements with random forest. The prediction of residual rather than the prediction of PM2.5 enlarged the response of predictions to variations in predictors, thus improved the prediction accuracy. The missingness in satellite retrievals was filled by decision-tree based modeling algorithm.

References:
- Geng, G., Xiao, Q., Liu, S., Liu, X., Cheng, J., Zheng, Y., Xue, T., Tong, D., Zheng, B., Peng, Y., Huang, X., He, K., & Zhang, Q. (2021). Tracking Air Pollution in China: Near Real-Time PM2.5 Retrievals from Multisource Data Fusion. Environ Sci Technol, 55, 12106-12115. [Link] [PDF]
- Xiao, Q., Zheng, Y., Geng, G., Chen, C., Huang, X., Che, H., Zhang, X., He, K., & Zhang, Q. (2021). Separating emission and meteorological contribution to PM2.5 trends over East China during 2000–2018. Atmos Chem Phys, 21, 9475-9496. [Link] [PDF]
- Xiao, Q., Geng, G., Cheng, J., Liang, F., Li, R., Meng, X., Xue, T., Huang, X., Kan, H., Zhang, Q., & He, K. (2021). Evaluation of gap-filling approaches in satellite-based daily PM2.5 prediction models. Atmos Environ, 244, 117921. [Link] [PDF]
PM2.5 species 10-km prediction model >
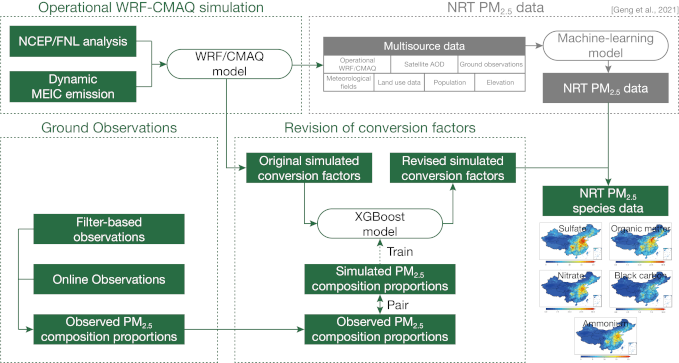
TAP developed PM2.5 species concentrations data set based on the published 10-km PM2.5 concentrations with complete spatial coverage. The methodology framework is shown below. The model extract PM2.5 species information from operational CMAQ simulations under the constraint of PM2.5 concentrations. To correct the bias of the CMAQ simulations, TAP first improved the windblown dust module, and then trained models to revise simulated PM2.5 species proportions based on ground measurements and extreme gradient boosting (XGBoost) algorithm. Having obtained more accurate PM2.5 species conversion factors, PM2.5 species concentrations were derived on the basis of PM2.5 data. The TAP-released PM2.5 species data include sulfate (SO42-), nitrate (NO3-), ammonium (NH4+), organic matter (OM), and black carbon (BC).
References:
- Geng, G., Zhang, Q., Tong, D., Li, M., Zheng, Y., Wang, S., & He, K. (2017). Chemical composition of ambient PM2.5 over China and relationship to precursor emissions during 2005–2012. Atmos Chem Phys, 17(14), 9187-9203. [Link][PDF]
- Liu, S., Geng, G., Xiao, Q., Zheng, Y., Liu, X., Cheng, J., & Zhang, Q. (2022). Tracking daily concentrations of PM2.5 chemical composition in China since 2000. Environ Sci Technol, 56, 16517–16527. [Link][PDF]
PM2.5 1-km prediction model >
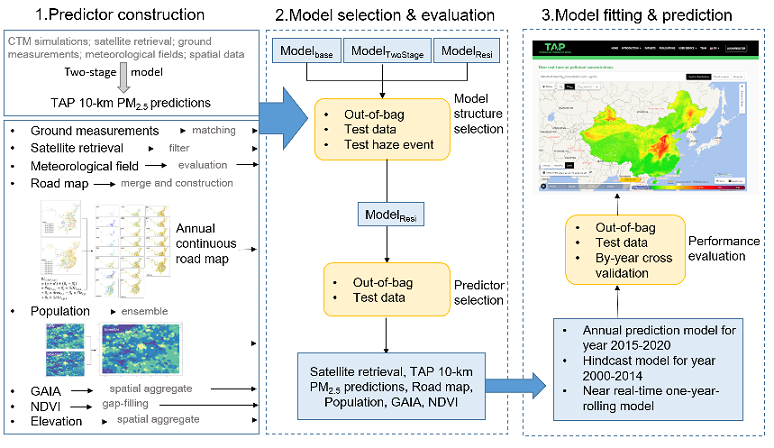
With the TAP PM2.5 at a 10-km resolution, the complete-coverage daily PM2.5 predictions at a 1-km spatial resolution from 2000 to the present were produced by fusing high-resolution satellite remote sensing retrievals and environmental spatial data (e.g. road maps) with a machine learning model. The structure of our model is shown below. To correctly reflect the temporal variations in land cover characteristics that significantly affected the pollution emissions, continuous annual geoinformation datasets, including the annual road distribution maps and ensemble gridded population distribution maps in China were constructed by spatial and statistical models. Then the random forest model was trained by the residual between 10-km TAP PM2.5 predictions and PM2.5 measurements in order to enlarge the response of predictions to variations in predictors.
References:
- Xiao, Q., Geng G., Liu, S., Liu, J., Meng, X., & Zhang, Q. (2022). Spatiotemporal continuous estimates of daily 1 km PM2.5 from 2000 to present under the Tracking Air Pollution in China (TAP) framework. Atmos Chem Phys, 22, 13229–13242. [Link][PDF]
O3 prediction model >
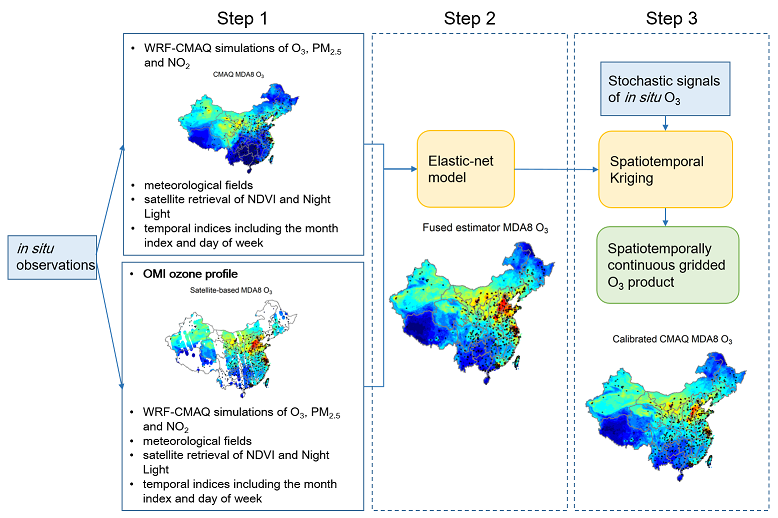
TAP developed a machine learning model to predict full-coverage daily maximum 8-h average O3 concentrations by fusing data from multiple sources. The model structure is shown below. The predictors include O3 measurements, satellite O3 vertical distribution profile, CMAQ simulations, WRF meteorological simulations, Normalized Difference Vegetation Index (NDVI), night light and population distribution. First, two random forest model were developed to describe the associations between O3 measurements and all the predictors, with and without the satellite O3 vertical distribution profile. Due to the missingness in satellite retrievals, the predictions from the model with satellite retrievals were spatiotemporally discontinuous. Then an elastic-net model was developed to fuse the predictions from the two random forest model in order to improve the prediction accuracy as well as fill the missingness. The last step simulate the residual of the fused predictions with a spatiotemporal Kriging interpolation.
Reference